


Update on Run Chart Rules
My API colleagues Lloyd Provost and Jerry Langley pointed me to a 2014 article by Anhøj and Olesen, “Run Charts Revisited: A Simulation Study of Run Chart Rules for Detection of Non-Random Variation in Health Care Processes” (PLOS One, http://dx.doi.org/10.1371/journal.pone.0113825).
Anhøj and Olesen look at the three run chart rules I reviewed in my post “Run Charts in Quality Improvement Work”, published 2 February 2015. They also offer useful guidance on run chart analysis as “Guidelines for Using and Interpreting Run Charts for Health Care Improvement.”
For the shift rule—number of consecutive values on one side of the median of a series of values—Anhøj and Olesen cite M. Schilling (2012), "The Surprising Predictability of Long Runs", Mathematics Magazine. 85, pp. 141–149 (available here). Schilling’s analysis leads to a simple formula for the number of consecutive values on one side of median that would be surprising, relative to series of independent realizations from a single probability distribution.
If you define n as the length of the original series, omitting any points that fall exactly on the median, the formula is: calculate log2(n) + 3 and then round to the nearest integer.
Using the simulation functions developed in R for my 2015 post, here’s the frequency of seeing 6, 7, 8 or 9 consecutive values on one side of a median for series of length n, n between 12 and 48.

Go to this GitHub repository for the R Markdown file that will produce the table shown here.
Restricting run chart analysis to series lengths less than n=20, the table shows that the rule “shift of six consecutive values on one side of the median” proposed by Perla et al. (2011) is a reasonable rule of thumb when looking for confirmation of improvement in short series.
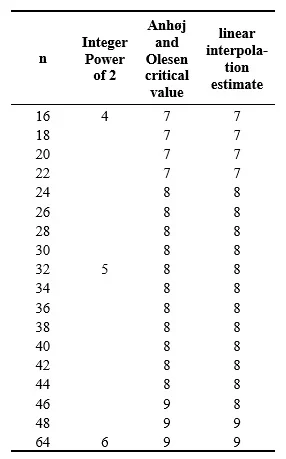
While the Anhøj and Olesen rule doesn’t make sense for a series of length 12--the longest shift on one side of the median is six consecutive values—it looks like a reasonable guide for run chart analysis if you can estimate the critical value, which depends on a base 2 logarithm. For the range of n in the table, just linearly interpolate between powers of 2. E.g. for a series of length n=22, 22 is less than halfway between 16 and 32, so the quick estimate critical value is log216 + 3 = 7. When length of the series is halfway or more to the next power of 2, use the higher power of 2: E.g. for n=48, 48 is halfway between 32 and 64, so the estimate of the critical value is log264 + 3 = 9.
On the other hand, as Lloyd Provost noted last year, for series longer than n=20, a control chart often can provide more insight than a run chart. You can augment the Shewhart “3 sigma rule” with a shift rule based on Anhøj and Olesen, as these authors suggest in the Guidelines section of their paper.

